
28 GHz Auction Result Summary
With the end of Auction 101, which focused on issuing remaining licenses 28 GHz band, final provisional winning bid (PWB) figures and statistics are now available via the FCC. The overall average bid price was $0.0113 / MHz POP, with bids being placed on licenses issued on a per county basis. The makeup of the licenses was primarily characterized by “lower tier” markets that consist of fewer people, with approx. 80% of the counties being considered to be Rural and 20% Urban[1]. In total, licenses covering approximately 23% of the U.S. population were auctioned. Bids varied widely, with the highest rate being $0.344 / MHz POP in Daggett County, UT (POPS ~1k) and the lowest being $0.0001919 / MHz POP in Murray County, OK (POPs ~13.5k).
Can the 28 GHz Auction Results Inform a 24 GHz Auction Prediction?
Given the 28 GHz Auction results, can we effectively predict the 24 GHz Auction? The first step to making an educated guess, in my view, is to first see what a full 28 GHz Auction might have looked like. The biggest variable between the two proceedings is that the 28 GHz Auction was on a county-based licensing regime, while the 24 GHz Auction will follow a Partial Economic Area (PEA) licensing regime instead.
The below chart demonstrates the 24 GHz band plan –
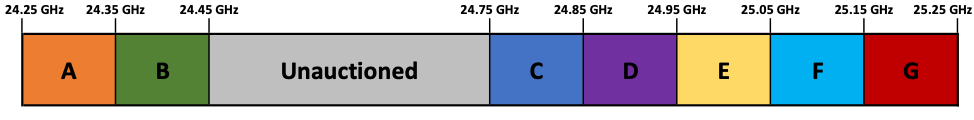
The 24 GHz proceedings, unlike the 28 GHz Auction, will be wide open for bidding in all 7 blocks across the entire US. The only exception is that Skyriver Spectrum holds three full PEAs in the Reno, Las Vegas, and Phoenix markets, and one partial PEA (spectrally) in the Albuquerque market – these frequencies will not be auctioned.
My methodology for predicting a full 28 GHz auction, as reasonably as possible, is as follows:
- Reconcile PWBs with their corresponding PEA
- In total, 281 PEAs were “auctioned” in Auction 101, in full or in part
- Filter out statistical skewing, locate most
relevant data points
- Remove PEA data points where the auctioned areas were Rural, whereas the full PEA is Urban (and vice versa) – 261 PEAs remaining
- Remove PEA data points where less than 50% of the full PEA MHz POPs were auctioned -194 PEAs remaining
- Remove PEA data points where the margin of the POP density difference between the full PEA area and the auctioned PEA area is > 50% for Urban PEAs, or >50% for Rural areas with a density of 50 POPs / Sq. Mile or more – 189 PEAs remaining
- Assign PEAs a Market Classification according to the POPs[2] of the full PEA license. I chose to use the following metrics:

These results are very interesting, as the pricing differences between the Minor Metro category and Semi-Rural category appears to go against past auction history and intuition. Spectrum in the mmWave bands can carry large amounts of data at high speeds, but requires line of sight to be functional. One would think that rural markets would command lower values, whereas more urban markets would command higher values. I primarily attribute this difference to the fact that county sized licenses likely allowed for smaller operators to bid up prices, especially in Semi-Rural markets and Minor Metro centers. In turn, the sample size of a mere seven PEAs isn’t enough to derive a strong analysis of markets with 1M POPs and up. Given these conditions, it is quite difficult to predict exactly what a full 28 GHz auction might have looked like.
Since we probably can’t arrive at a precise number only using the Auction 101 data, an estimate will need to suffice. Using our largest samples as an anchor (Semi-Rural, Mostly Rural categories) I have made educated guesses on what the rates may have reasonably been in a full auction of all US counties:

The above largely assumes that the competitive nature of the county-licensing in rural areas would have translated into higher-tier markets as well, with competitive bidding occurring between major carriers. Using this as a baseline, I will consider the following factors for a 24 GHz Auction prediction:
- PEA licensing should translate into fewer rounds of bidding and less competition from smaller bidding entities in more rural markets, which will in turn lower prices in rural areas.
- Larger markets may be fairly unpredictable – since on the one hand T-Mobile does not yet have a majority position in any mmWave band, like Verizon (or even a significant position, such as AT&T in 39 GHz). Turnout from Verizon and AT&T will be unpredictable, seeing as both, as mentioned, do already have significant portfolios.
- Less spectrum and fewer MHz POPs are being auctioned should depress total $ figures (700 MHz in the 24 GHz band plan, vs. 850 MHz in the 28 GHz band plan).
- 24 GHz spectrum propagates better and should in turn command higher values (on average I will use a 10% estimate).
- 24 GHz licenses will be 100 MHz, whereas licenses in the 28 GHz band are 425 MHz. Generally, the availability to get more capacity commands higher values. This aspect is hard to predict for the 24 GHz auction – on the one hand, values will be depressed – seeing as 100 MHz is worth less than 425 MHz in a single license. However, there could be considerable upward pressure on prices from competition to obtain multiple licenses and form contiguous blocks of spectrum. I will not be factoring this into my analysis due to the difficulty in quantifying the potential impact, but did want to make a note of it.
Overall, my prediction has a larger skew between Rural and Urban areas – with generally higher predicted prices in Urban markets and lower ones in Rural markets, relative to the 28 GHz Auction:

In total, a $7.16B total auction price is predicted. It will be interesting to compare this analysis to the actual results, and see how far (or how close) this estimation ultimately comes.
Written By: Zachary Thompson, Senior Analyst at Select
Spectrum
[1] The FCC considers a rural county to have an average population density <100 POPs / sq. mile, while an urban county having an average population density of >100 POPs / sq. mile.
[2] 2017 POP figures were utilized in this step, resulting in variation from the POPs used by the FCC in the Auction 101 proceedings.